The evolution of healthcare analytics
Amidst all the discussion about 'big data' and 'learning health systems', I'd like to take this opportunity to introduce a concept – that of 'devolved analytics'. I believe this has a part to play in achieving a better quality healthcare system through the use of large-scale healthcare data.
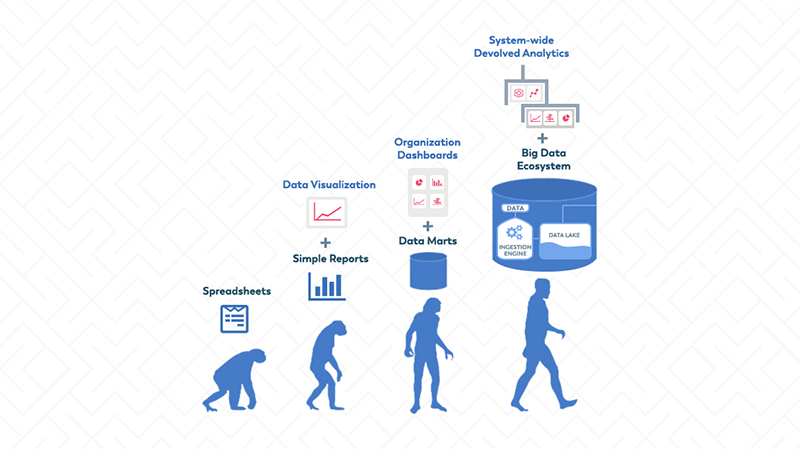
To help put this into context, first a brief bit of history. The illustration below shows the evolution of healthcare analytics to date. The first steps are recognisable to most businesses: organizations start with simple spreadsheets and then move on to produce simple management reports with some graphical visualization of key outputs. Some organizations are firmly at the second stage, successfully managing data via simple reports and data visualization. However, many still have a long way to go and are not even at this stage yet.

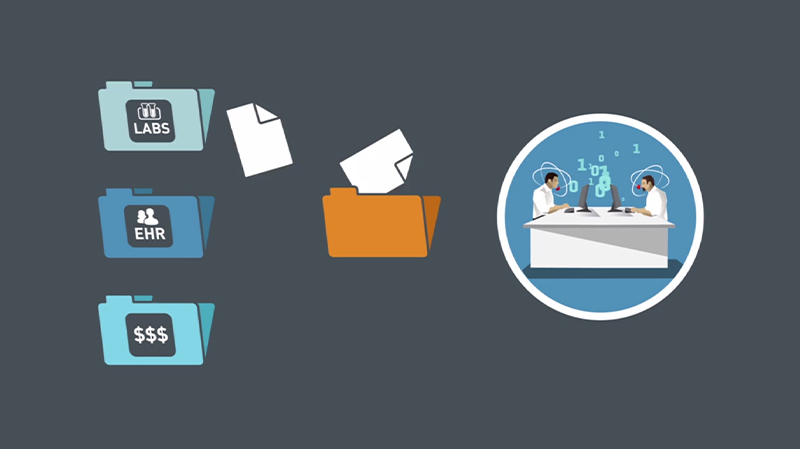
The third stage is where the analytics becomes more complex. Many healthcare institutions have established data marts or enterprise data warehouses, which contain data drawn from multiple sources within the organization and a range of different types of data, such as clinical data, financial data, etc.
More complex and more sophisticated analyses are then undertaken by a central IT or Informatics team and delivered in the form of ‘dashboards’. These enable key members of the institution to explore what is going on in their area or overall. Unlike simple reports, most dashboards are interactive and enable the viewer to ‘drill down’ into more or less detail as they wish.
To deliver such outputs, organizations typically invest in both data warehousing technology and analytical software. But they also usually have to invest in specialist personnel to produce such reports. This is the stage that many NHS organizations and a high proportion of US organizations are at. However, over time the limitations of this approach have started to make themselves felt:
-
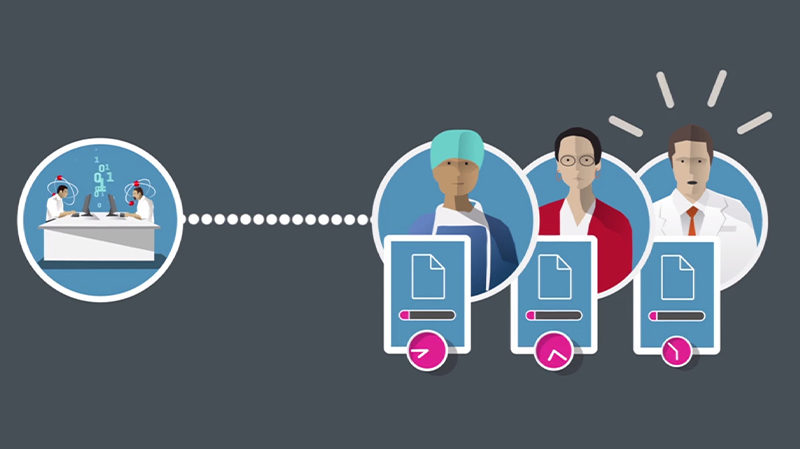
The availability of attractive in-depth analytics stimulates demand for more. This is typically far in excess of the time and resources available of the central team to deliver. This leads to frustrating and ever-increasing delays in response to requests.
-
Users often request modifications of existing dashboards, which can be time-consuming to produce and can even involve having to re-work the original dashboard.
-
Users become frustrated by the lack of transparency of the outputs. The logic of how precisely an output has been produced is typically unavailable, making it difficult for users to trust the findings or explore how they have been arrived at.
-
Users become frustrated by their inability to explore why things are as they are and what the implications would be if things were different.

These limitations inevitably lead to a growing demand for greater transparency, more types of output and greater freedom for end users to explore their data themselves, rather than relying exclusively on a central team. At the same time, the central management overhead involved in keeping the show on the road starts to exceed what the organization can afford. This is the situation that many, if not most, health organizations find themselves in today.
The Arrival of Big Data (Stage 4)
In parallel with the evolution just described, over the past two to three years, ‘big data’ has well and truly begun to arrive. Many healthcare organizations (the NHS and the more advanced US hospital systems, especially those such as medical schools with a strong research emphasis) have long realised the potential value of ‘big data’. Consequently, they have invested considerable time and money in collating large-scale healthcare databases to support clinical research, population health management and improvement in the quality and outcomes of care.
Furthermore, the range of data being collated is much broader than that which provided the foundation for the first three stages. It now includes data from medical devices, free text from electronic health records, data from personal devices such as Fitbits, social media data, publicly available consumer data and genomic data.
To cope with this expansion, cloud-based ‘Big Data Ecosystems’ have been developed, capable of ingesting and managing vast quantities of data and presenting it in a variety of ways for analysis.
The Human and Technical Challenge
It is important to understand why traditional analytical tools struggle in this new environment. It is not simply a question of supply not being able to keep up with demand. It is rather that the volume and breadth of demand has exposed the technical limitations of standard approaches at scale. For example:
-
The number of users capable of writing complex queries in a large organization will always be small, relative to the number of users wishing to explore data. Therefore, if report creation facilities are going to be made available to large numbers of end users, it must be possible to create reports in a manner that does not require a high level of specialist technical expertise.
-
Similarly, if large numbers of users are going to be able to access data for many different purposes, then it must be possible to control what people are allowed to do with which data in a fine-grained manner.
Most existing systems do not meet these requirements in a scalable manner. Hence the situation has arisen that many organizations sitting on ‘data lakes’ are hamstrung in their ability to deliver the distributed access required to achieve most benefit from them. Over the past six months, this has been the problem we have encountered over and over again, both in the US and Europe (including the NHS). A new approach is needed in order to unlock the value of large-scale healthcare data.
The Need for Devolved Analytics
Such ‘big data’ requires analytical platforms to be able to cope with an exponential jump in both the complexity of access rules and the range of users, both specialist and non-specialist, who will need to access different combinations and permutations of data for multifarious purposes.
What is required is truly ‘devolved analytics’ – the ability to flexibly devolve analytic capabilities as required to different groups within an organization, taking into account their skills, position and purpose. However, it is becoming increasingly evident that many existing tools on the market have simply not been designed with this in mind.

Key Requirements of Devolution
The concept of devolved analytics brings with it a number of requirements:
Flexible delivery model: devolution requires the ability to support a range of delivery models. This could be anything from a specialist central informatics team that creates highly sophisticated reports and distributes outputs to end user ‘consumers’, to a fully democratised model whereby end users throughout the organization can access any data and create any reports they wish.
Self-service report creation: there is no realistic prospect of large numbers of healthcare professionals acquiring the specialist skills required to write complex reports using query languages. So a devolved model of analytics must necessarily involve extensive user-friendly ‘self-service’ reporting capabilities for which no specialist database or querying expertise is required.
Furthermore, report creation needs to be designed in such a manner that the user ‘can’t go wrong’ by producing illogical queries that produce uninterpretable outputs.
Permissions model: a devolved model also requires the ability to control access to data, functionality and outputs in a highly granular manner, since different groups of staff will need to be highly restricted in what data they are permitted to see and what they can do with it. This requirement becomes even stronger in multi-organizational environments, where organizations collaborate to share data based upon complex data-sharing agreements.

Democratisation, data literacy and specialisation
Devolved analytics has the potential to enable a massive democratisation of analytics, giving ownership of insights to the end user and embedding the routine use of data in everyday practice in countless new ways. But new technologies can only be part of the solution. A significant increase in data literacy is also going to be required of the workforce, hopefully facilitated by a new generation of software tools designed to make this as painless as possible.
In the same way that the introduction of electronic health records required practitioners to learn to type and navigate software menus, so devolved analytics will require them to gain basic skills in manipulating and interpreting data. The speed with which health communities will truly learn from their experience will in part be determined by the ability of its members to absorb the implications of data insights into their practice.
Similarly, the democratisation of analytics doesn’t mean that the days of the informatics specialist are numbered. Quite the reverse. One strategy for addressing the shortage of informatics skills is to devolve capability, thus freeing up the specialists that are available to focus on the complex predictive analytics, statistical modelling and algorithm development that is the true province of the specialist and will never be undertaken by the jobbing practitioner.
Devolved analytics is therefore not a quick fix, but a necessary step in the direction of truly unlocking the value of large-scale health data.
Let’s get going!